Convolution in Python
This page can be downloaded as interactive jupyter notebook
This tutorial covers the implementation of a convolution in Python.
Definition
- I: Image to convolve.
- H: filter matrix to convolve the image with.
- J: Result of the convolution.
The following graphics shows exemplary the mathematical operations of the convolution. The filter matrix H is shifted over the input image I. The values ‘under’ the filter matrix are multiplicated with the corresponding values in H, summed up and writen to the result J. The target position is usually the position under the center of H.

Example: Blurring with a square block filter
In order to implement the convolution with a block filter, we need two methods. The first one will create the block filter matrix H depending on the filter width/height n.
A block filter holds the value $\dfrac{1}{n\cdot n}$ at each position:
import numpy as np

def block_filter(n):
    H = np.ones((n, n)) / (n * n) # each element in H has the value 1/(n*n)
    return H
We will test the method by creating a filter with n = 5:
H = block_filter(5)
print(H)
[[0.04 0.04 0.04 0.04 0.04]
 [0.04 0.04 0.04 0.04 0.04]
 [0.04 0.04 0.04 0.04 0.04]
 [0.04 0.04 0.04 0.04 0.04]
 [0.04 0.04 0.04 0.04 0.04]]
Next, we define the actual convolution operation. To prevent invalid indices at the border of the image, we introduce the padding p.
def apply_filter(I, H):
    h, w = I.shape                         # image dimensions (height, width)
    n = H.shape[0]                         # filter size
    p = n // 2                             # padding size
    J = np.zeros_like(I)                   # output image, initialized with zeros

    for x in range(p, h-p):
        for y in range(p, w-p):
            J[x, y] = np.sum(I[x-p:x+n-p, y-p:y+n-p] * H)
    return J
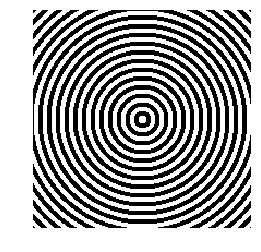
To test our method we create a example image:
I = np.zeros((200, 200), dtype=np.float)
for x in range(200):
    for y in range(200):
        d = ((x-100)**2+(y-100)**2)**0.5
        I[x, y] = d % 8 < 4
We will use mMatplotlib to visualize the image:
import matplotlib.pyplot as plt

plt.imshow(I, cmap='gray',vmin=0.0, vmax=1.0)
plt.axis('off')
plt.show()
Next we test our implementation and apply a block filter with size 7:
n = 7
H = block_filter(n)
J = apply_filter(I, H)

plt.imshow(J, cmap='gray',vmin=0.0, vmax=1.0)
plt.axis('off')
plt.show()
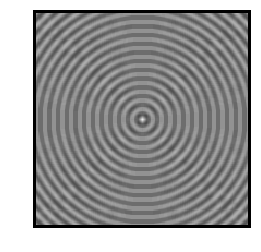
We can observe the blurring effect of the filter as well as the black border around the image, where no values were computed. To remove the black border one can increase the size of I by the filter padding p. This is usually done by appending zeros around the image or repeating/ mirroring the original borders.
| Author: | Dennis Wittich |
| Last modified: | 02.05.2019 |