Random Sample Consensus (RANSAC)
This page is available for practice as an interactive jupyter notebook.
Plane determination using 3 points
If 3 points are given, plane parameters can be computed using the Hessian Normal Form (HNF).
HNF: $d=-\hat{n}p$ with $d\in\mathbb{R}$ a scalar representing the distance to the coordinate system origin, $\hat{n}\in\mathbb{R}^3$ normlized normal vector and $p\in\mathbb{R}^3$ some 3D point.
HNF can be determined from thre points $p_1,p_2,p_3 \in \mathbb{R}^3$ as follows:
-
Normal vector: $n = (p_2 - p_1)\times(p_3 - p_1)$
-
Normalization: $\hat{n}=\frac{n}{| n |}$
-
Calculat distance to origin: $d = - \hat{n}p_1$
Segmentation with normal vectors/planes
Local normal vectors and plane parameters are usefull features for such tasks as segmentation, classification, visualization and many more.
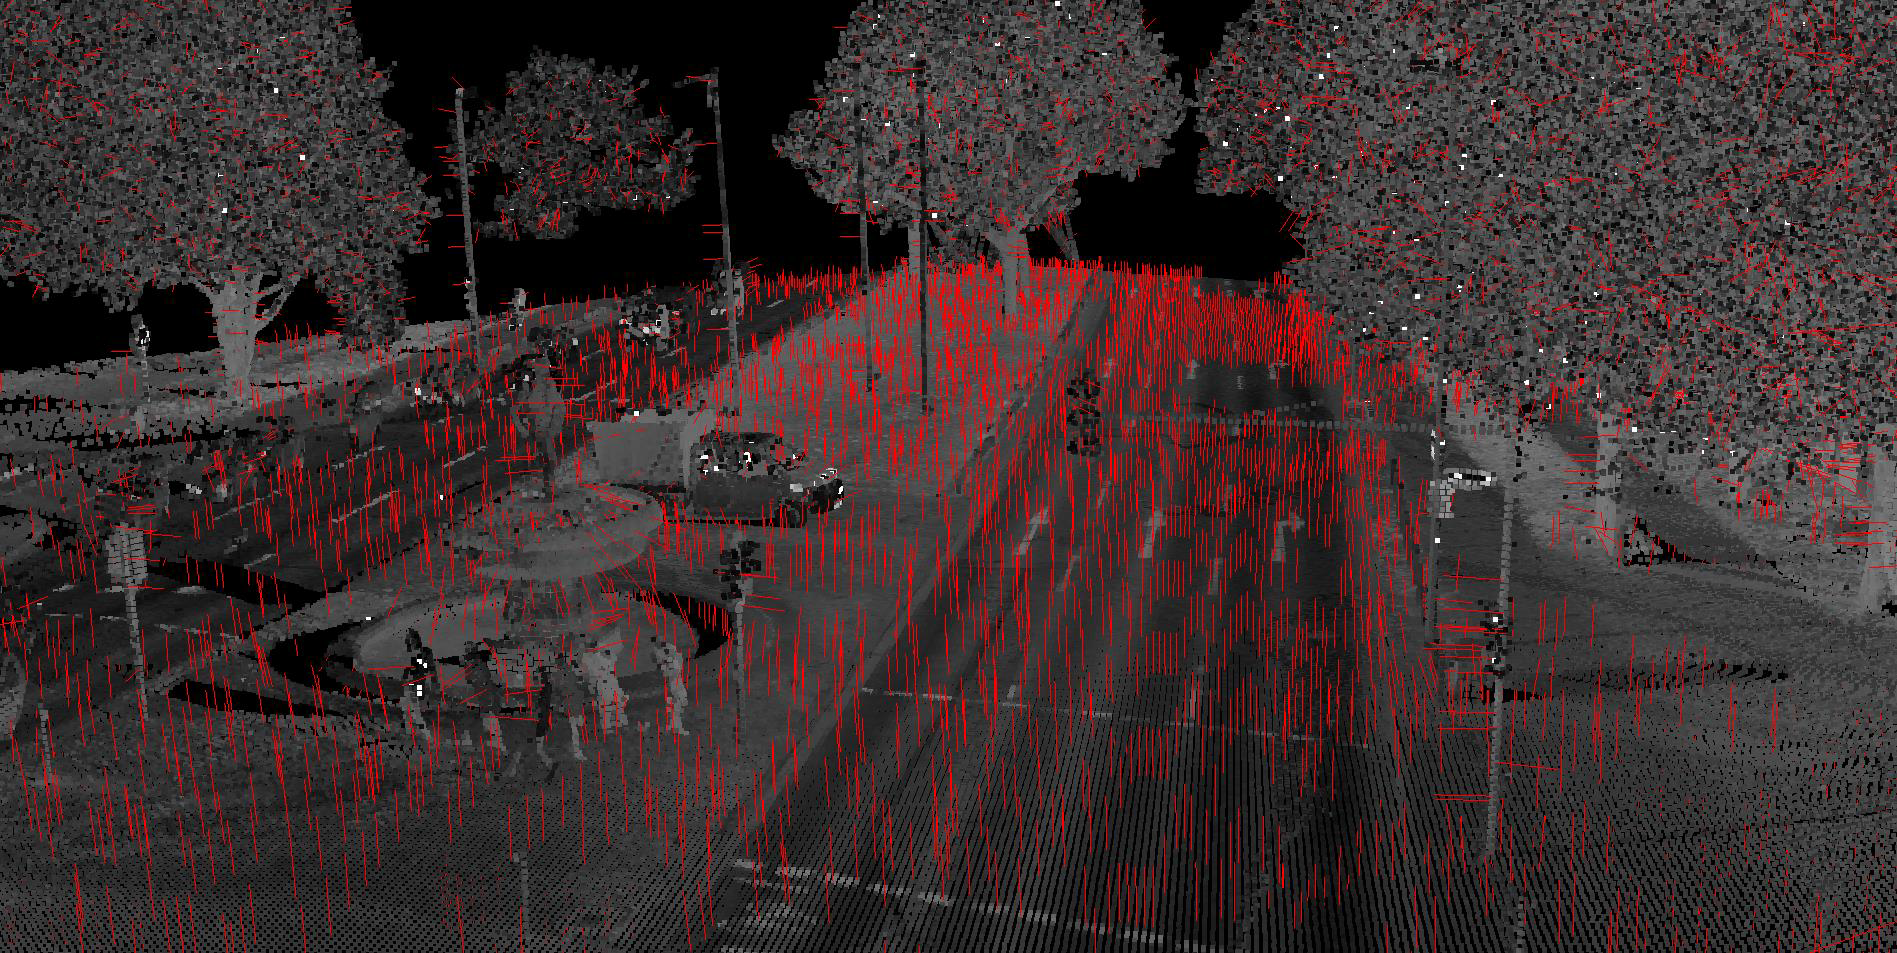
This image shows how different regions like ground and vegetation can be distinguished by different normal vector distributions.
Segmentation with RANSAC
In the following task we will determine plane parameters from a cloud of points employing random sample consensus (RANSAC). The main idea of RANSAC is to estimate multiple sets of plane parametersbased on randomly selected sub sets and evaluate each plane on the whole set of points. The best matching plane is then kept.
Algorithm
- Compute min. number of iterations
- $w$: Prob. that a drawn observation belongs to the model
- $n$: Number of necessary observations (here: 3)
- $z$: Desired probability z with which the model shall be found
- Randomly pick 3 points
- Compute plane parameters from these three points
- Count consensus
- Define max. distance point-plane
- Repeat k times
- Choose plane with max. consensus set
- Compute final plane parameters using all plane points
Task
You are given two point sets schneiderberg15cm_1.ply and schneiderberg15cm_2.ply. Goal is to fit one plane to the first scene and two planes to the second scene.
-
Detect the correct planes in scene 1 and two planes in scene 2 by using RANSAC. You have to estimate the required number of draws. You have to define the probabilities w, that a drawn observation belongs to a model, and z with which the model shall be found.
-
Choose a sufficient value for the max. point distance to a wall
max_diff. Justify your decision in the report. -
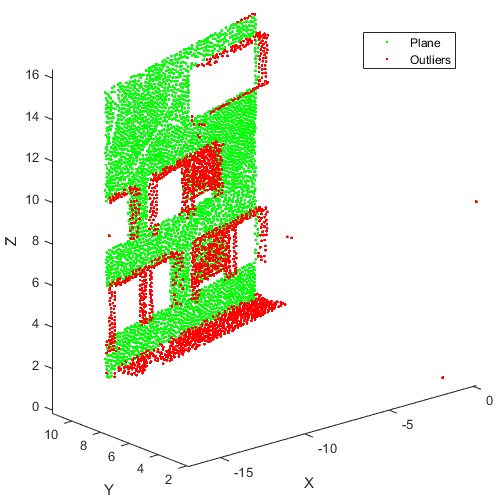
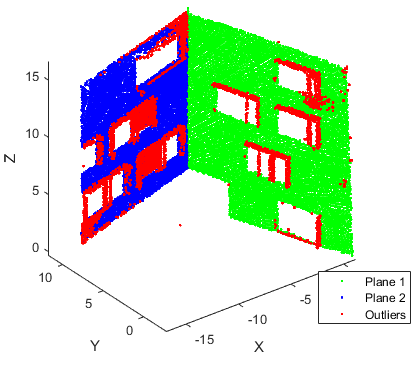
Plot the planes and outliers of both scenes
Scene 1
Scene 2
import random
#Usefull for the selection of random points:
print(random.sample(range(1, 100), 4))
[26, 92, 37, 50]
def find_random_points(samplesize, points):
    """Finds a set of unique random points from a point cloud
    :params:
        samplesize - size of the generated set
        points - set of points from which random points are selected

    :return:
        list of random points
    """
    ### BEGIN SOLUTION
    random_indx = random.sample(range(1, points.shape[0]), samplesize)
    random_points = []
    for ind in random_indx:
        random_points.append(points[ind,:])
    ### END SOLUTION
    return random_points
# use HNF here generate plane from 3 points
def plane_from_3_points(points):
    """Determines the normal vector of a plane given by 3 points

    :params:
        points - list of 3 points
    :return:
        (n,d) - Hesse normal from of a plane
                n - normalized normal vector
                d - distance from origin
    """
    ### BEGIN SOLUTION
    a = points[0]
    b = points[1]
    c = points[2]

    v_ab = b - a
    v_ca = a - c
    n = np.cross(v_ab, v_ca)
    n = n/np.linalg.norm(n)

    d = np.inner(n, a)
    ### END SOLUTION
    return n, d
def count_consensus(n,d,max_diff,points):
    """Counts the consensus
       counts the consensus and gives back the
       line numbers of the corresponding points

        :params:
            n - normal vector of the plane
            d - distance of the plane from origin
            max_diff - max distance of a point to plane
            points - array of points

        :return:
            new_points - list - Consensual points
            outliers - list - Outlier points
    """
    ### BEGIN SOLUTION
    new_points = []
    outliers = []
    for p in points:
        diff = np.inner(n,p) - d
        if abs(diff) <= max_diff:
            new_points.append(p)
        else:
            outliers.append(p)
    ### END SOLUTION
    return new_points, outliers
import math

# implement RANSAC
def ransac(points, z, w, max_dif):
    '''Finds the normal vectors of the planes in a scene

    :params:
        z: likelihood, that plane can be found
        w: outliers in percent
        t: treshold for accepted observations
    :return:
        n: - normalized normal vector
        d: - distance from origin
        new_points: - list - Consensual points
        outliers: - list - Outlier points
    '''
    ### BEGIN SOLUTION
    samplesize = 3
    b = w**samplesize
    k_max = math.ceil(np.log10(1 - z)/np.log10(1-b))
    max_points = []
    for k in range(k_max):
        p_random = find_random_points(samplesize,points)

        n, d = plane_from_3_points(p_random)

        #[m_list(k)] = count_consensus(n_list(k,:),d(k),max_diff,points);
        new_points, new_outliers = count_consensus(n,d,max_diff,points)
        if  len(new_points) > len(max_points):
            max_points = new_points
            outliers = new_outliers
            n_max = n
            d_max = d
    ### END SOLUTION
    return n_max, d_max, max_points, outliers
from plyfile import PlyData
import numpy as np

# load data

_data = PlyData.read('schneiderberg15cm_1.ply').elements[0].data
schneider1 = np.stack((_data['x'], _data['y'], _data['z']), axis=1)
_data = PlyData.read('schneiderberg15cm_2.ply').elements[0].data
schneider2 = np.stack((_data['x'], _data['y'], _data['z']), axis=1)


print(schneider1)
print(schneider2)
[[ -0.29499999   3.61199999  -0.14300001]
 [-13.90999985   8.6079998    4.2670002 ]
 [-14.03199959   8.54300022   4.19799995]
 ...,
 [-10.16800022   9.54500008  13.10000038]
 [-10.04800034   9.20199966  12.78800011]
 [  0.19599999   1.83099997   8.70300007]]
[[ -0.29499999   3.61199999  -0.14300001]
 [-13.90999985   8.6079998    4.2670002 ]
 [-14.03199959   8.54300022   4.19799995]
 ...,
 [ -3.56599998  11.59200001   8.68299961]
 [ -1.09500003   3.76200008  16.45499992]
 [ -3.63199997  11.74100018  16.63400078]]
#Apply RANSAC to determine planes

# Scene 1
##
z = 0.99 # Wahrscheinlichkeit zum Finden der Ebene
w = 0.55 # Anzahl der Ebenenpunkte
max_diff = 0.1 # Maximaler Abstand eines Punktes zur Ebene
n, d, new_points, outliers = ransac(schneider1, z, w, max_diff)
print("Result: {}".format((len(new_points),len(outliers))))
Result: (3929, 1842)
# plot results
# you may use following example code or ploting framework you prefer
import ipyvolume.pylab as ply

ply.scatter(schneider2[:,0], schneider2[:,1], schneider2[:,2], size=0.5, color='red')
ply.scatter(schneider1[:,0], schneider1[:,1], schneider1[:,2], size=0.5, color='green')
ply.show()
VBox(children=(Figure(camera=PerspectiveCamera(fov=46.0, position=(0.0, 0.0, 2.0), quaternion=(0.0, 0.0, 0.0, …
| Author: | Artem Leichter |
| Last modified: | 2019-04-30 |