Classification - Random Forest
This page is available for practice as an interactive jupyter notebook. Random Forests use several decision trees to classify objects based on specific features. In this exercise you should determine 3D features for every pixel of a depth image generated by a Microsoft Kinect v2. In the next step, every pixel shall be assigned to a specific class using these features.
Label Ground Truth
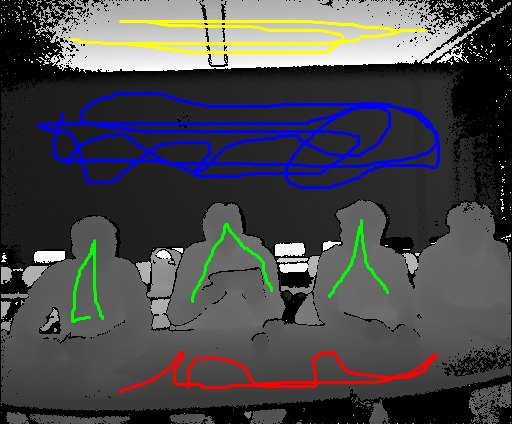
We need training data for our random forest. Therefore we will label data manually. Open the file depthImage_gt.png in an image editor (like paint). Color following classes in the image:
# imports
from plyfile import PlyData
import numpy as np
from imageio import imread
from numpy.linalg import svd
import math
from sklearn.neighbors import KDTree
# Hier we need the code from the last assignment.
# This is good place to load label and map them to points.
def depth_to_vector(img, img_gt, f=365.5953, cx=260.1922, cy=209.5835):
    """ Converts depth raster to 3D coordinates

        img: 2D Raster with depth values stored at each cell
        img_gt: 2D Raster with 4 channels the first 3 of the are R G B. May the 4th channel be ignored
                by you.
        f: Focal distance
        (cx, cy): center point

        class ids no_class: 0, person: 1, wall: 2, ceiling: 3, table: 4

        return: numpy array of 4d vectors x, y, z and the class id.
    """
    # YOUR CODE HERE
    raise NotImplementedError()
    return points
Feature implementation
We calculate features for a set of points $P \in \mathbb{R}^{3\times}$. Minimal size of the set should be $4$. All features are based on the eigenvalue decomposition of the matrix $P^TP$. The eigenvalues can be used to compute linearity, planarity and scattering. The normal vector and standard deviation of a local plane can be computed same as in pca algorithm.
def tensor(points):
    '''Calculate eigenvalues and eigenvectors of P^TP
        points: set of points

        return eigenvalues, eigenvectors (ordered)
    '''
     # YOUR CODE HERE
     raise NotImplementedError()

def linearity(l):
    ''' calculate lineratiry based on eigenvalues
        l: ordered eigenvalues

        return linearity

    '''
     # YOUR CODE HERE
     raise NotImplementedError()


def planarity(l):
    ''' calculate planarity based on eigenvalues
        l: ordered eigenvalues

        return planarity

    '''
    # YOUR CODE HERE
    raise NotImplementedError()


def scattering(l):
    ''' calculate scattering based on eigenvalues
        l: ordered eigenvalues

        return scattering

    '''
    # YOUR CODE HERE
    raise NotImplementedError()


def calc_feat(vectors, r):
    '''
        vectors: numpy array of 4d points x, y, z and the class id.
        r: radius for the feature calculation

        return numpy array of 4+5d vectors inputvector with 4 elements + 5 feature values
    '''
    # YOUR CODE HERE
    raise NotImplementedError()
    return vectors
Application
Apply the implemented methods.
Feature
Determine the following features for every colored pixel: linear, planar and volumetric elements, normal vector in z direction, standard deviation of a local plane, height. Choose a suitable value for the radius of the neighborhood and justify your decision in the report. These features are later used to assign every pixel to a specific class.
img = imread('depthImage.png')
img_gt = imread('depthImage_gt.png')
# Change this part if your implementation is different
the_vectors = depth_to_vector(img, img_gt)
feat = calc_feat(the_vectors, 25) # calculate Features for all points
feat = feat.astype(np.float32) # cast whole array to float32
feat = feat[~np.isinf(feat).any(axis=1)] # remove infinit values
feat = feat[~np.isnan(feat).any(axis=1)] # remove NaNs


#Split points int train set with known classes.
train = feat[feat[:,3]!= 0,:]
predict = feat[feat[:,3]== 0,:]

# Use RandomForestClassifier from sklearn
from sklearn.ensemble import RandomForestClassifier
# YOUR CODE HERE
raise NotImplementedError()
import ipyvolume.pylab as ply
def plot_points(points, prediction):
    colors = np.empty((prediction.shape[0],3))
    colors[prediction == 0,:] = np.array((0,0,0))
    colors[prediction == 1,:] = np.array((255,0,0))
    colors[prediction == 2,:] = np.array((0,0,255))
    colors[prediction == 3,:] = np.array((255,255,0))
    colors[prediction == 4,:] = np.array((0,255,0))
    ply.clear()
    ply.scatter(points[:,0], points[:,1], points[:,2], size=0.5, color=colors)
    ply.show()
Visulization
Visualize your results. You may use the plot_points function
# YOUR CODE HERE
raise NotImplementedError()
Results
Describe the results. How could you improve them? How could you quantize the performance of the classification? How could you measurer the generalization capability of your classifier. Test different radii for the feature calculation and compare the results.
Expected outcome of the classification looks like this:
| Author: | Artem Leichter |
| Last modified: | 2019-04-30 |